
View on GitHub

Open this notebook in GitHub to run it yourself

Quantum Hadamard Edge Detection for Image Processing

Based on the paper: “Edge Detection Quantumized: A Novel Quantum Algorithm for Image Processing” https://arxiv.org/html/2404.06889v1 This notebook demonstrates:
  1. QPIE (Quantum Probability Image Encoding) encoding
  2. QHED (Quantum Hadamard Edge Detection) algorithm
The encoding was implemented based on this paper: https://arxiv.org/pdf/1801.01465
import math
from typing import List

import matplotlib.pyplot as plt
import numpy as np

from classiq import *

# original
photo = []
photo = plt.imread("Marina Bay Sands 128.png")

plt.imshow(photo)
Output:
<matplotlib.image.AxesImage at 0x168cc3e90>
  

output
segments = [i / 255 for i in [0, 30, 60, 90, 120, 150, 180, 210, 255]]
image = np.array(photo)
# print(segments)
# print(image)
for i in range(1, len(image)):
    for j in range(len(image[i])):
        pixel = image[i][j][0]
        for s in segments:
            if pixel >= s:
                image[i][j][0] = s
                image[i][j][1] = s
                image[i][j][2] = s
# print("AFTER THE UPDATE")
# print(image)
plt.imshow(image)
image = np.array(photo)
output

QPIE Encoding Implementation

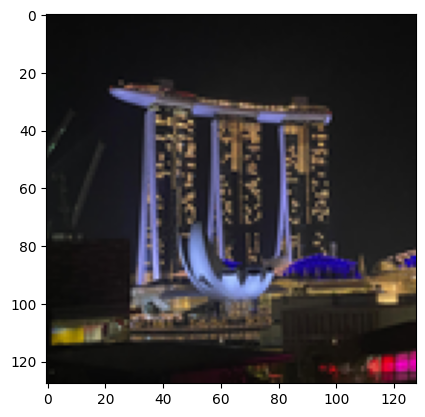
Convert an image into valid QPIE probability amplitudes. The image is converted to grayscale if needed, made non-negative, and L2-normalized so the sum of squared values equals
  1. The result is stored as an n×nn \times n array IMAGE_DATA.
def image_to_qpie_amplitudes(image: np.ndarray) -> np.ndarray:
    """
    Convert an image to QPIE probability amplitudes as an n×n array.
    |img⟩ = Σ(x,y) (I_xy / √(Σ I_xy²)) |xy⟩
    """
    if len(image.shape) == 3:
        image = np.mean(image, axis=2)

    n = image.shape[0]
    assert image.shape == (n, n), "Image must be square"

    image = np.abs(image)
    norm = np.sqrt(np.sum(image**2))
    if norm == 0:
        return np.ones((n, n)) / n
    return (image / norm).T

IMAGE_DATA = image_to_qpie_amplitudes(image)
n = IMAGE_DATA.shape[0]
N_PIXEL_QUBITS = math.ceil(math.log2(n))
print(f"Image: {n}x{n}, pixel qubits per axis: {N_PIXEL_QUBITS}")
Output:

Image: 128x128, pixel qubits per axis: 7
  

print(f"Total pixels: {n*n}")
Output:

Total pixels: 16384
  

Modified QHED Algorithm

We define an ImagePixel QStruct with separate x and y registers, and load the image via lookup_table — the amplitudes are computed classically from the pixel coordinates and loaded with prepare_amplitudes. The QHED algorithm detects edges by:
  1. Adding auxiliary qubits in +|+\rangle state
  2. Controlled shifts of xx (horizontal) and yy (vertical) by 1-1
  3. Applying Hadamard to compute differences
  4. Measuring to get edge information
from classiq.qmod.symbolic import logical_or


class ImagePixel(QStruct):
    x: QNum[N_PIXEL_QUBITS]
    y: QNum[N_PIXEL_QUBITS]


def image_amplitude(x: float, y: float) -> float:
    ix, iy = int(x), int(y)
    if 0 <= ix < n and 0 <= iy < n:
        return float(IMAGE_DATA[ix, iy])
    return 0.0


@qfunc
def qpie_encoding(pixel: Output[ImagePixel]):
    amps = lookup_table(image_amplitude, [pixel.x, pixel.y])
    prepare_amplitudes(amps, 0, pixel)


@qfunc
def quantum_edge_detection_scalable(
    edge_aux: Output[QBit],
    pixel: Output[ImagePixel],
):
    qpie_encoding(pixel=pixel)

    horizontal_edge = QBit()
    vertical_edge = QBit()
    allocate(horizontal_edge)
    allocate(vertical_edge)

    within_apply(
        within=lambda: H(horizontal_edge),
        apply=lambda: control(horizontal_edge, lambda: inplace_add(-1, pixel.x)),
    )
    within_apply(
        within=lambda: H(vertical_edge),
        apply=lambda: control(vertical_edge, lambda: inplace_add(-1, pixel.y)),
    )

    edge_aux |= logical_or(horizontal_edge, vertical_edge)
    drop(horizontal_edge)
    drop(vertical_edge)


print(f"Creating {n}x{n} image edge detection model...")
Output:

Creating 128x128 image edge detection model...
  

Synthesize and Analyze the Quantum Circuit

The model is synthesized with a 20-qubit width limit and a long timeout, and finally exported as quantum_image_edge_detection with 15-digit numeric precision.
@qfunc
def main(
    pixel: Output[ImagePixel],
    edge_aux: Output[QBit],
):
    quantum_edge_detection_scalable(edge_aux=edge_aux, pixel=pixel)

qprog = synthesize(
    main,
    constraints=Constraints(max_width=20),
    preferences=Preferences(timeout_seconds=14400),
)

print(f"\n{n}x{n} Image Circuit Statistics:")
print(f"  

- Number of qubits: {qprog.data.width}")
print(f"  

- Circuit depth: {qprog.transpiled_circuit.depth}")
print(
    f"  

- Number of gates: {qprog.transpiled_circuit.count_ops if hasattr(qprog.transpiled_circuit, 'count_ops') else 'N/A'}"
)
Output:
128x128 Image Circuit Statistics:
    

- Number of qubits: 17
    

- Circuit depth: 32813
    

- Number of gates: {'u': 16617, 'cx': 16584}
  

show(qprog)
Output:

Quantum program link: https://platform.classiq.io/circuit/3AlGcDNufmf2h6AwpUBoej5fGk8
  

qprog = set_quantum_program_execution_preferences(
    qprog, preferences=ExecutionPreferences(num_shots=200000)
)
res = execute(qprog).result()[0].value
res.dataframe
pixel.x pixel.y edge_aux counts probability bitstring
0 64 92 0 167 0.000835 010111001000000
1 37 89 0 165 0.000825 010110010100101
2 64 91 0 163 0.000815 010110111000000
3 62 91 0 161 0.000805 010110110111110
4 70 95 0 158 0.000790 010111111000110
17277 115 127 1 1 0.000005 111111111110011
17278 118 127 1 1 0.000005 111111111110110
17279 119 127 1 1 0.000005 111111111110111
17280 120 127 1 1 0.000005 111111111111000
17281 122 127 1 1 0.000005 111111111111010

17282 rows × 6 columns

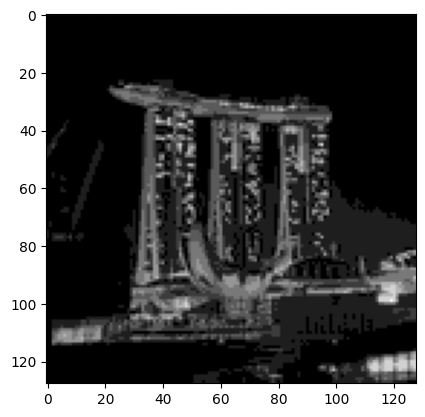
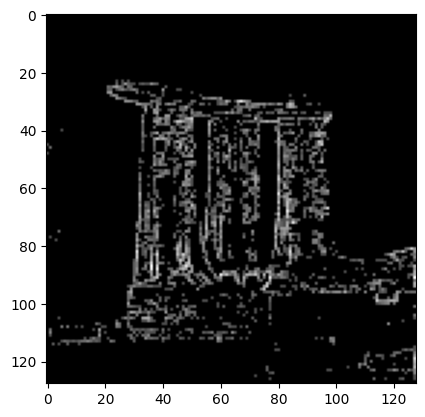
Create Edge Image From Measurement Results

If edge_aux == 1 then it is marked as an edge pixel. The new amplitude is calculated based on the number of shots measured for that pixel, normalized by the total number of shots.
df = res.dataframe
edge_df = df[df["edge_aux"] == 1]

edge_image = np.zeros((n, n))
for _, row in edge_df.iterrows():
    edge_image[int(row["pixel.x"]), int(row["pixel.y"])] = np.sqrt(row["probability"])
Analyze amplitude distributions
plt.hist(edge_image.flatten())
Output:
(array([1.2776e+04, 0.0000e+00, 1.3470e+03, 1.1560e+03, 5.5400e+02,
          2.6500e+02, 2.0400e+02, 6.4000e+01, 9.0000e+00, 9.0000e+00]),
   array([

0.        , 0.00104881, 0.00209762, 0.00314643, 0.00419524,
          0.00524404, 0.00629285, 0.00734166, 0.00839047, 0.00943928,
          0.01048809]),
   <BarContainer object of 10 artists>)
  

output Some amplitudes are extremely small and can be treated as noise; discarding them yields a cleaner edge image.
edge_image = np.where(edge_image > 0.003, edge_image, 0)
plt.hist(edge_image.flatten())
Output:
(array([1.4123e+04, 0.0000e+00, 0.0000e+00, 1.1560e+03, 5.5400e+02,
          2.6500e+02, 2.0400e+02, 6.4000e+01, 9.0000e+00, 9.0000e+00]),
   array([

0.        , 0.00104881, 0.00209762, 0.00314643, 0.00419524,
          0.00524404, 0.00629285, 0.00734166, 0.00839047, 0.00943928,
          0.01048809]),
   <BarContainer object of 10 artists>)
  

output The resulting edge-detected image
plt.imshow(edge_image.T, cmap="gray")
Output:
<matplotlib.image.AxesImage at 0x179311590>
  

output In comparison, the original image is:
plt.imshow(image)
Output:
<matplotlib.image.AxesImage at 0x179377290>
  

output